SUMMARY
由于Starlink网络和调度算法不透明,难以优化网络性能和验证方案,因此文章尝试测量Starlink性能。
Main findings
- Starlink routes traffic from user terminals to their ground stations in a two-step process:
- global network controller 根据负载、地理空间条件、卫星电能等因素向每个用户终端分配卫星(每15秒全球更新)。
- local on-satellite controller 调度其服务用户的数据流。 文章通过4个分散在不同地区的终端(时间同步)和FCC文件验证上述发现。
- Starlink卫星分配的倾向性:
- 仰角高:距离更近,对latency,RSS和energy都更友好
- North:从实验结果来看,更倾向North West
- 新卫星:降低卫星寿命差距,以allow the constellation to stay stable for longer
- 阳面:降低卫星能源消耗,从实验结果看,仅当dark satellite的仰角有明显优势时才会选择dark satellite
Methodology
文章利用starlink-grpc-tools获取2D obstruction map,其处理思路值得借鉴。
EXPERIMENT
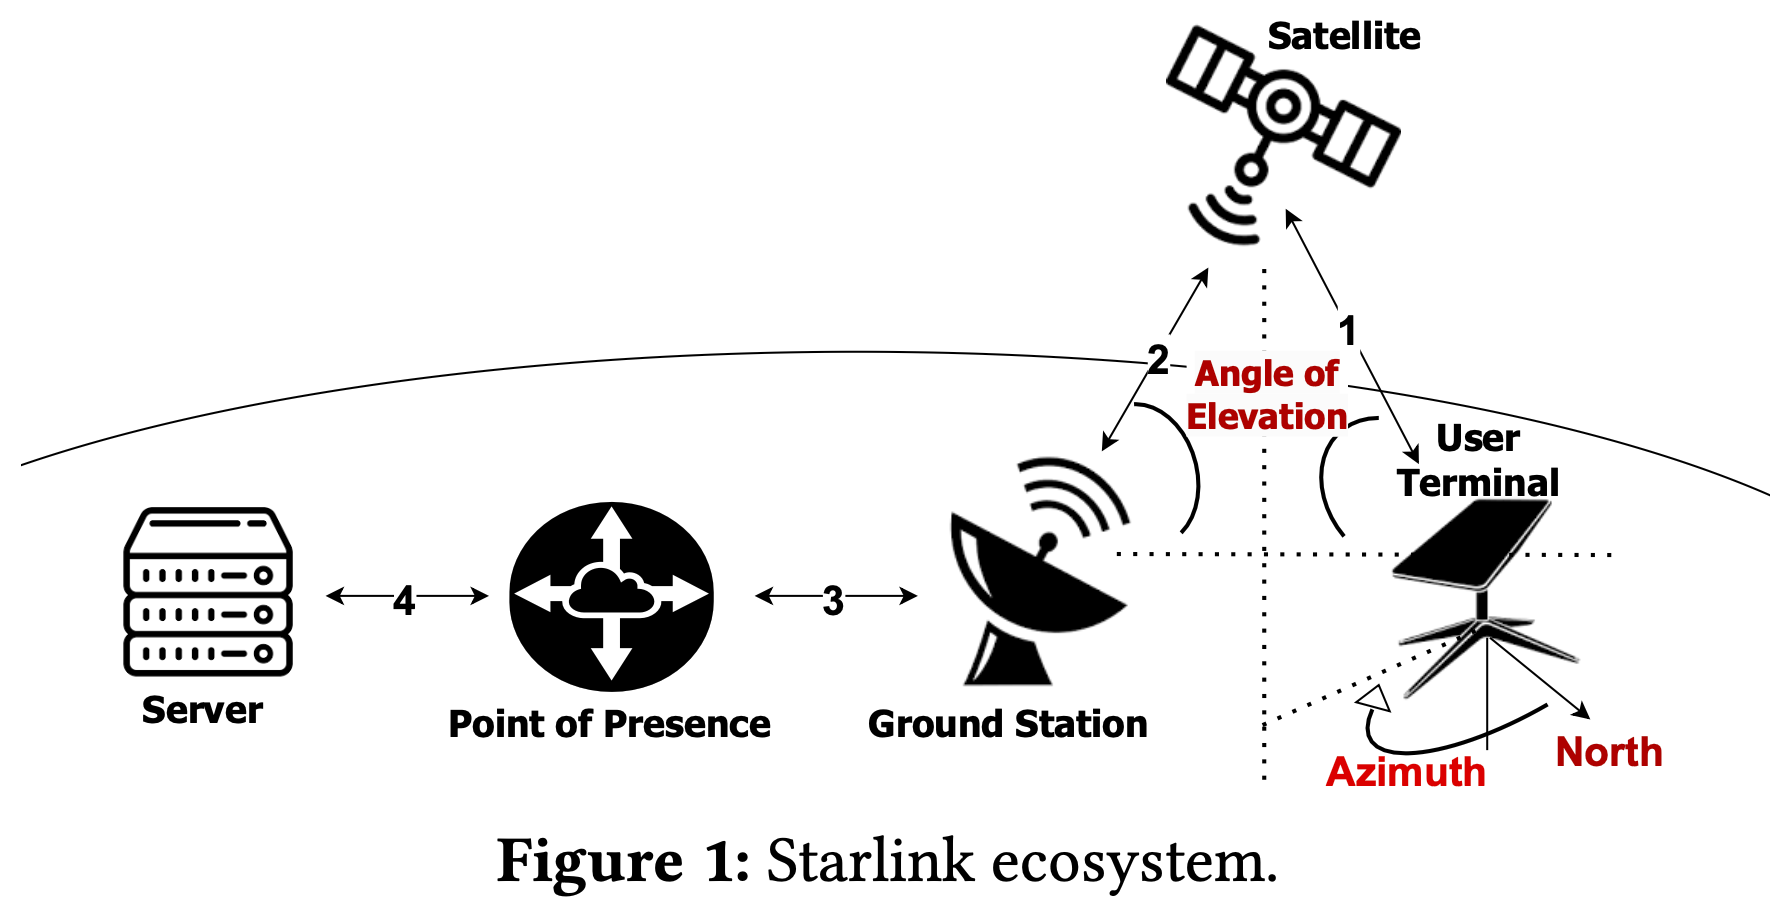
如图所示是Starlink结构图,其中elevation和azimuth是文章确定接入卫星的两个关键变量。
Setup
- 探针:4个Starlink终端,位于Western Europe, Northeast US, Midwest US, and Northwest US.
- Router配置:configure the Starlink router to operate in bridge mode and connect it to a dedicated Raspberry Pi via Ethernet.
- 探测目的地:the destination of measurements are servers colocated at the Starlink PoPs assigned to the regions of our user terminals. 问题:探测PoP节点返回的是粗粒度的城市级信息,如何确定所在地区PoP的准确位置?
- 测量指标: round-trip times and packet loss rates between sources and destination servers.
Packets were sent using iRTT at the rate of 1 packet/20 ms and iPerf3 at a bandwidth of 50% of the upstream connection. - 其他:Record high-resolution round-trip times and packet loss rates. The clocks of vantage points and servers were routinely synchronized using NTP.
Observation
基于如下图所示RTT结果,得到两个观察:
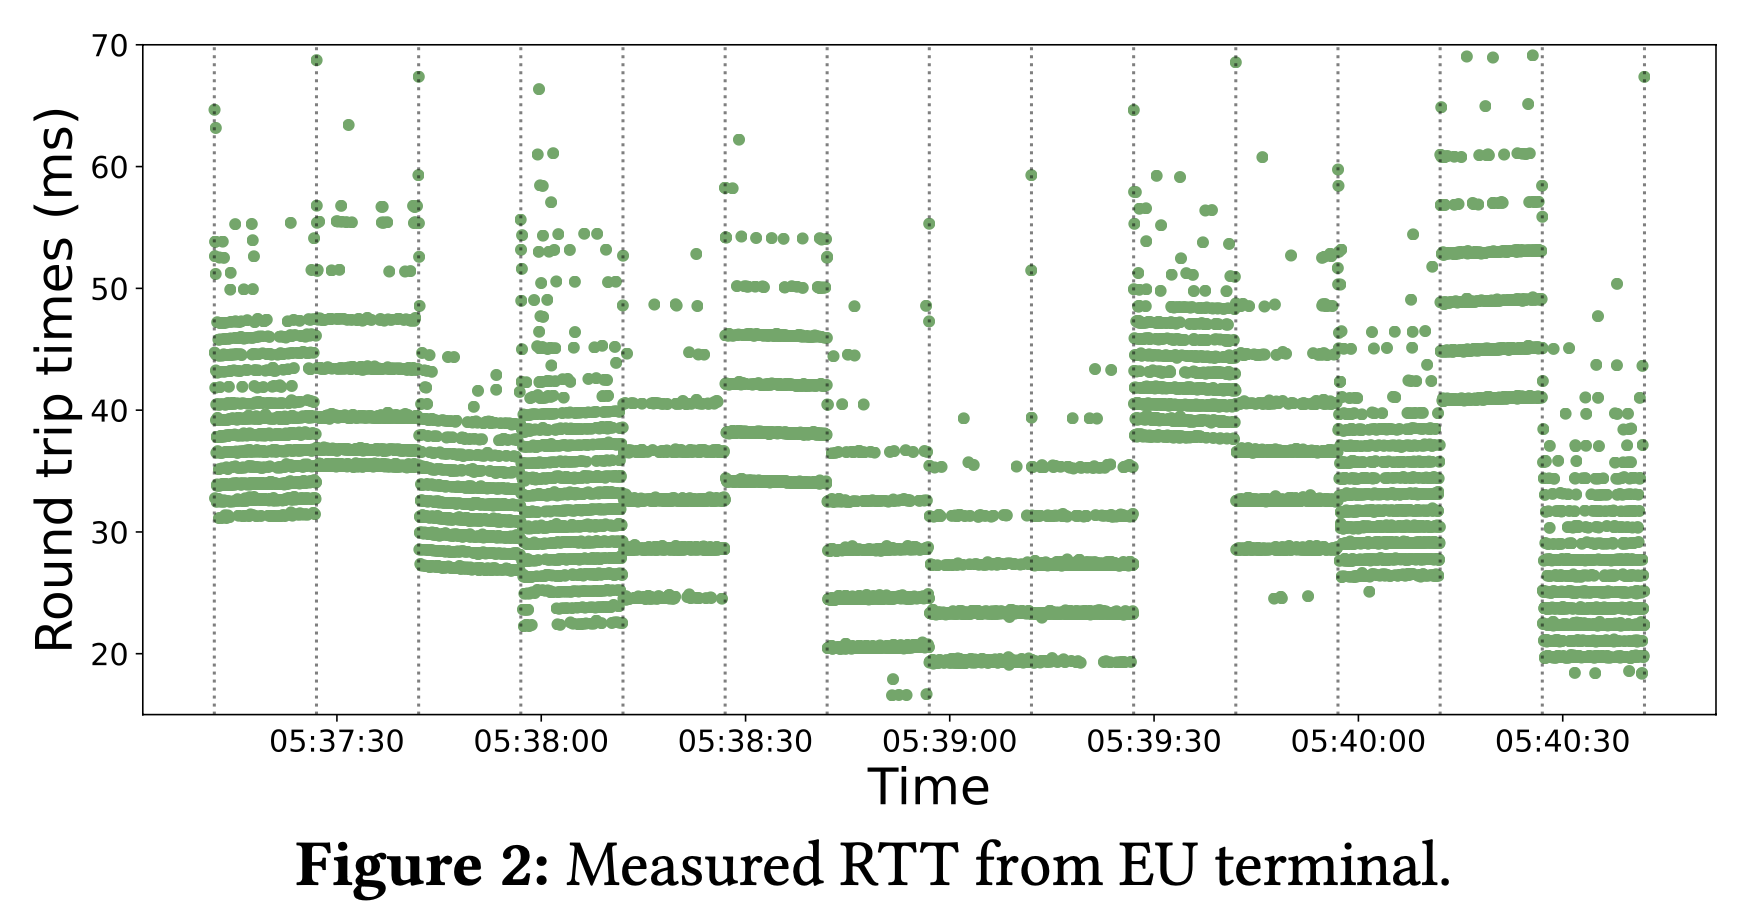
1. Starlink relies on a global controller for satellite-to-terminal scheduling.
分布在不同位置的4个终端都观测到如图所示 RTT 15秒改变一次的现象,文章认为其实验配置已经消除了地面网络等外部因素的影响,且在FCC文档中找到了对应的描述,所以认为上述finding是可信的。
FCC文档中对应描述如下:

2. Starlink uses an on-satellite controller for scheduling terminal flows.
The second peculiar characteristic of the latency measurements from our user terminals is that within the fifteen-second time interval, latency measurements the user terminal frequently form parallel bands that are a few milliseconds apart.
OBTAINING SATELLITE ALLOCATIONS
文章利用Starlink的obstruction maps来识别分配给特定用户终端的卫星。
Data
1. Obstruction maps:
Obstruction maps are 123px x 123px, 2-dimensional images that mark the trajectory of satellites that recently served the user terminal. The authors use starlink-grpc-tools to extract the 2-D obstruction maps every 15 seconds from each terminal.
2. Satellite positions:
The paper uses CelesTrak to get the TLEs for Starlink satellites, then uses the SGP4 satellite propagation algorithm to calculate satellite positions.
Methods
1. Uncovering gRPC obstruction map parameters:
2D obstruction map 只包含白色像素,这些白色像素描绘了最近连接的卫星的轨迹,没有任何进一步的背景信息(例如,仰角和方位角)。 为此,文章将记录的2D地图与Starlink应用程序上观察到的3D地图对齐。
From this alignment, we find that: (1) the 2-d obstruction map is a polar plot centered at 62x62; (2) the radius of the polar plot represents the angle of elevation and ranges from 25 to 90; and (3) the θ of the polar plot represents the azimuth, where θ = 0 represents the North.
由于obstruction map是一个包含polar plot的正方形,我们还需要获得这个正方形内polar plot的边界。
文章通过连续两天保持终端在线来实现这一目标。 在两天的时间里,终端将与几乎所有可见范围内的卫星建立连接。 这将导致gRPC地图中的polar plot区域基本上完全着色,因为gRPC地图不会重置(除非终端离线)。
使用图3e所示地图,确定polar plot的半径为45px。

2. Isolating satellite trajectory:
we perform an XOR operation on the obstruction map from x and x-1 (i.e., the prior 15-second slot).
这将删除两个图共有的卫星轨迹,只有在x slot终端连接的卫星的轨迹可见。
我们要求卫星轨迹不要与以前连接的卫星的轨迹重叠(因为XOR会消除重叠)。 为了确保满足此条件,我们每10分钟执行一次终端重置(因为重置终端会启动一个新的gRPC地图)。
问题:10分钟是如何确定的?
3. Identifying serving satellites:
- 根据TLE数据传播,得到在特定时刻可见的所有卫星的ID;
- 计算卫星的elevation和azimuth;
- 将轨迹信息转换到笛卡尔坐标系,并且计算Dynamic Time Warping (DTW)距离,比较与测量结果的相似度,最相似的即为服务卫星。
文章对比了计算结果和人工确认结果,有99%的情况二者是相同的,由此认为极大概率这种方案是对的。
We validate our similarity matching via a manual (visual) pilot test study, in which the authors manually identified the best match between 500 sets of gRPC and TLE trajectories. The DTW similarity method and our manual tests overlapped on over 99% of all outcomes.
DISCUSSION OF FACTORS AFFECTING STARLINK'S GLOBAL SCHEDULER DECISIONS
Satellite position
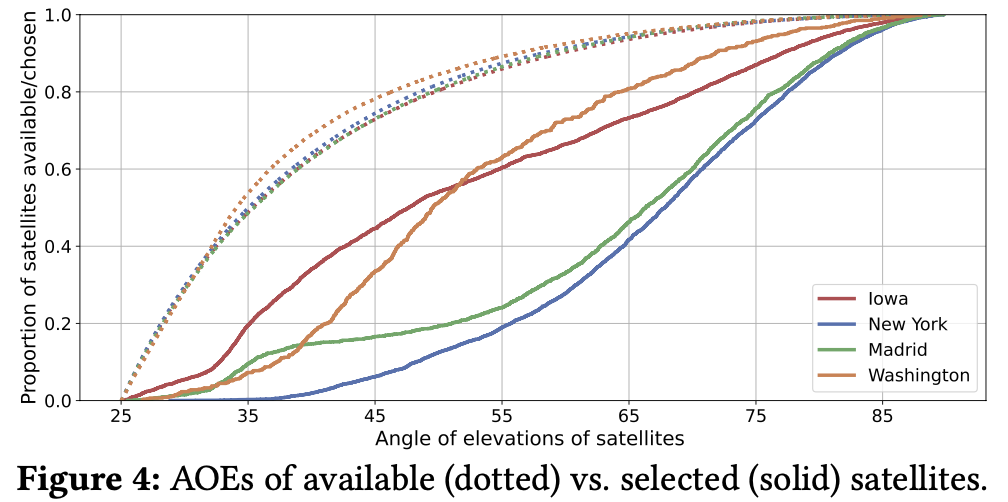
The position of a satellite in the sky is defined by its AOE and azimuth with respect to the user terminal.
更倾向选择仰角高的卫星。
更倾向选择北方的卫星(North West)。
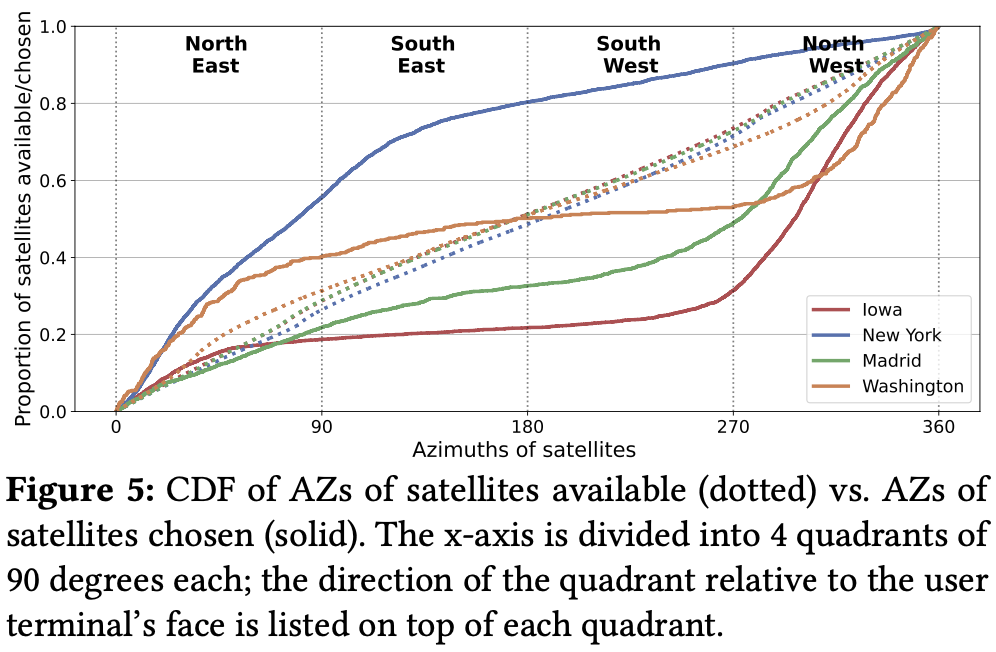
文章认为原因有二: (1) ITU对干扰的限制导致网络倾向为终端分配仰角更高,距离更近的卫星。 (2) 仰角越高,距离越近,能耗越低。
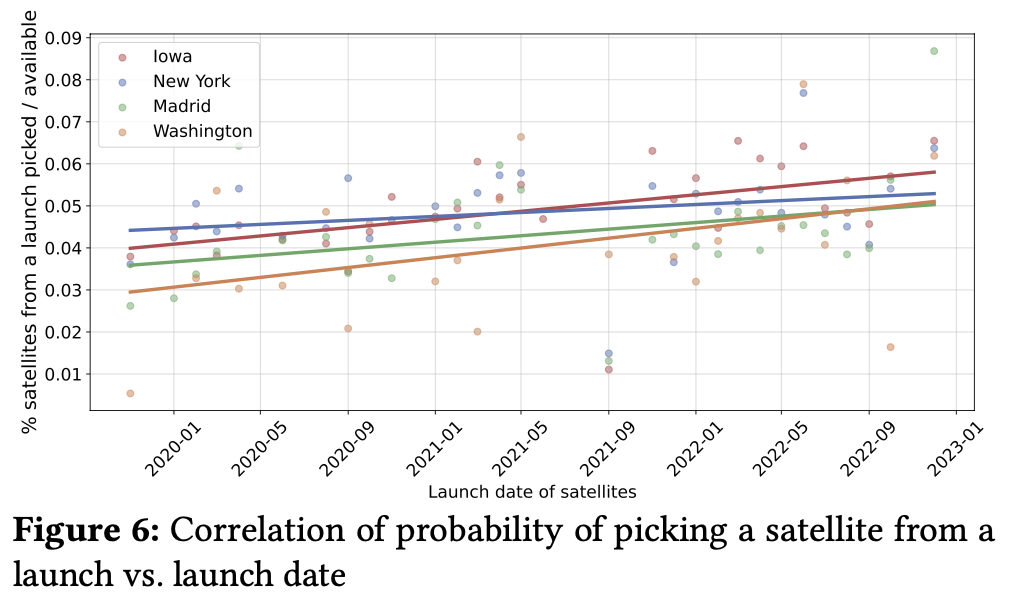
Satellite launch dates
更倾向选择新发射的卫星,可降低卫星寿命差距,让星座在更长一段时间内保持稳定。
Being sunlit
The global scheduler opts for the sunlit satellites 72.3% of the time averaged over all locations. We also find that the global scheduler only picks dark satellites during 15 second slots where the %(dark/available) satellites is >= 35% (averaged over all locations).
从实验结果看,倾向选择阳面的卫星,仅当阴面卫星的仰角有明显优势时才会选择阴面卫星。
MODELING
1. Feature selection:
Cluster the available satellites based on their azimuth (θ), angle of elevation (ϕ), age (a), and sunlit status (ε).
2. Training, testing, and validating:
- A random forest model because of its robustness to overfitting and the explainability of its predictions.
- Got the parameters of the model using grid-search and five-fold cross-validation.
3. Evaluating:
- Top-k-accuracy metric
- Baseline model: simply returns the (top-𝑘) cluster(s) with the most number of available satellites as its prediction.
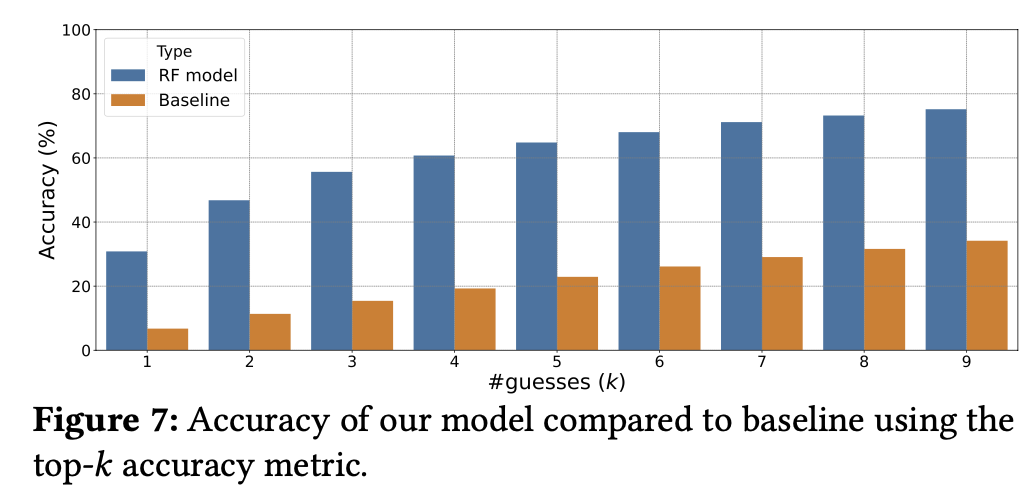
在每个time slot进行验证,每次推测k个cluster,只要包含正确卫星在的cluster,则认为正确。 统计所有slot的结果,得到准确率。
验证的粒度是非常粗的,且baseline太弱了,根据前面对三种因素的讨论设计多种对比方案更有价值。
4. Limitation:
We expect that other publicly-unavailable features such as terminal density in a region and satellite load characteristics will also impact the global scheduler.
THINKING
优点:文章利用grpc获取2D obstruction map图,并结合TLE数据推测接入卫星的思路值得借鉴。
缺点:- 文章只关注了global controller,没有展开讨论local on-satellite controller的部分。这部分相对困难,可利用的外部信息较少,获取在后续投稿版本中会有更多讨论。
- method部分有的说法需要更清晰的表述,细节上有不清晰的地方。比如,为什么每10分钟重启就可以解决轨迹重复的问题?这个粒度是合适的吗?
- 文章所提模型的粒度比较粗,目前版本很难准确推测接入卫星,采用RF模型有些shallow了。
- 仅讨论了position, launch dates和sunlit指标的影响,其他指标没有讨论。
- Baseline太弱了,根据前面对三种因素的讨论设计多种对比方案更有价值。
Link to paper: Making Sense of Constellations: Methodologies for Understanding Starlink's Scheduling Algorithms